
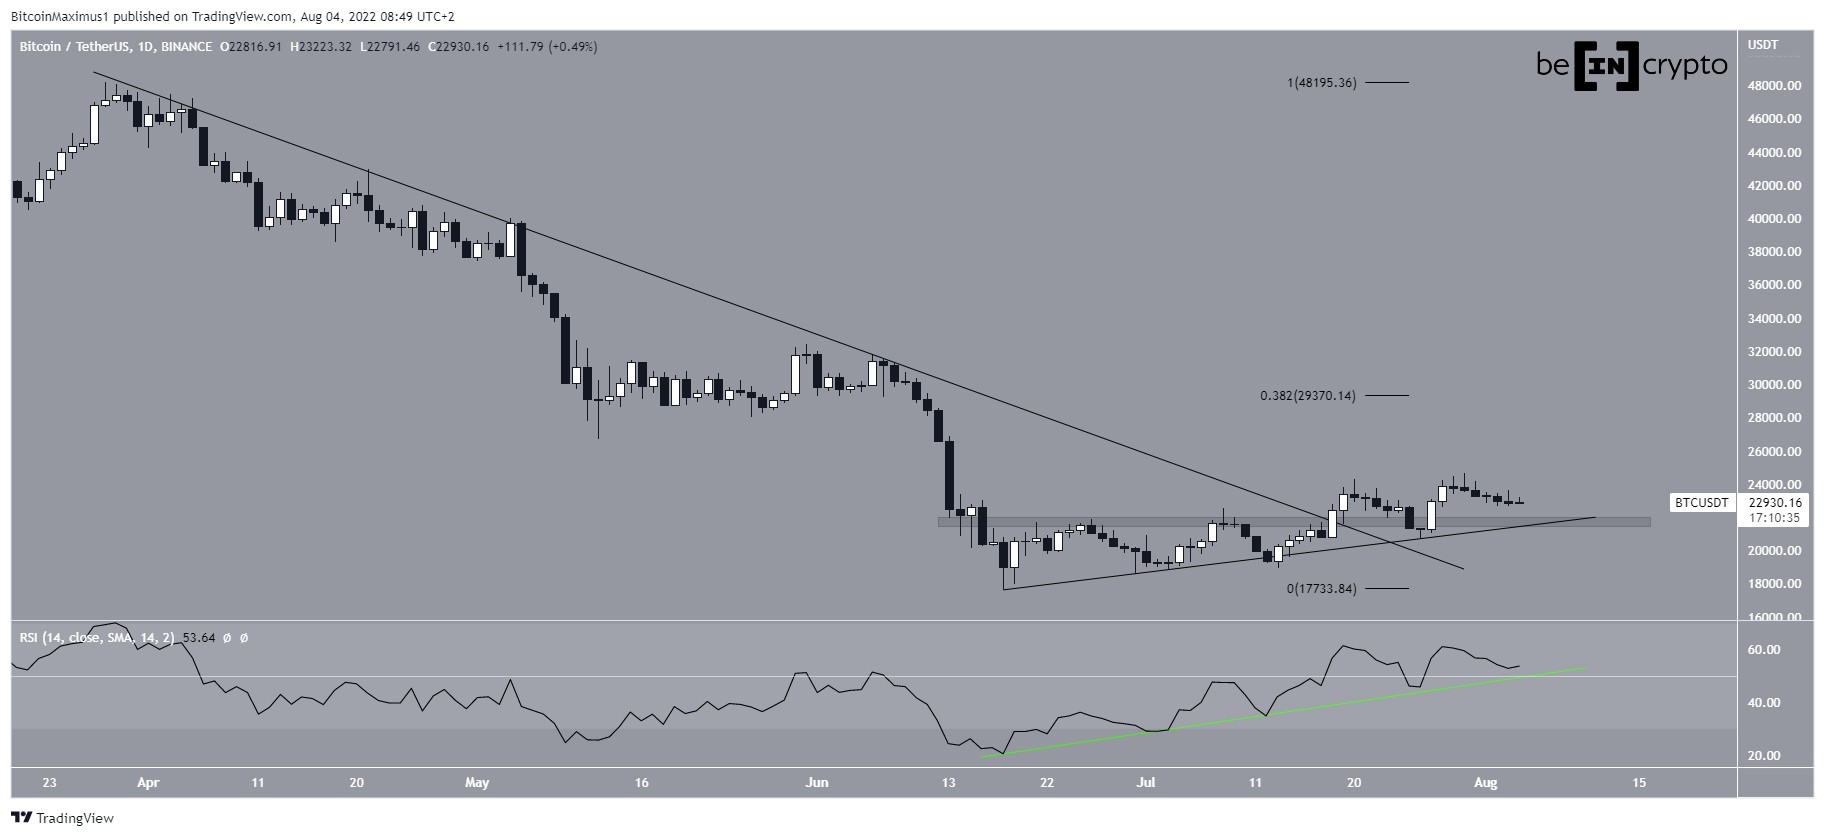
Bitcoin (BTC) Stuck Above $22,700 Support
Bitcoin ( BTC ) made a bullish breakout from a short-term falling wedge pattern but failed to develop a meaningful advance.
BTC has been trading above the rising support line since June 18. The Bitcoin exchange rate tested this line many times. The last time this happened was on July 26, after which the price formed a high of $24,668 on July 30.
Throughout this period, the daily RSI has also been moving along a descending resistance line (green), which remains unbroken. In addition, the RSI is holding above the 50 mark.
In the process of rising, BTC managed to make a bullish breakout of the $21,750 horizontal resistance area and the descending resistance line, which had been present on the chart since the end of March. However, the price has not been able to develop significant growth. Instead, we may see a pullback after a bullish breakout.
Strong support is located in the $21,750 area. It is formed by an ascending support line and a horizontal support area.
Source: Trading View
Current Pattern
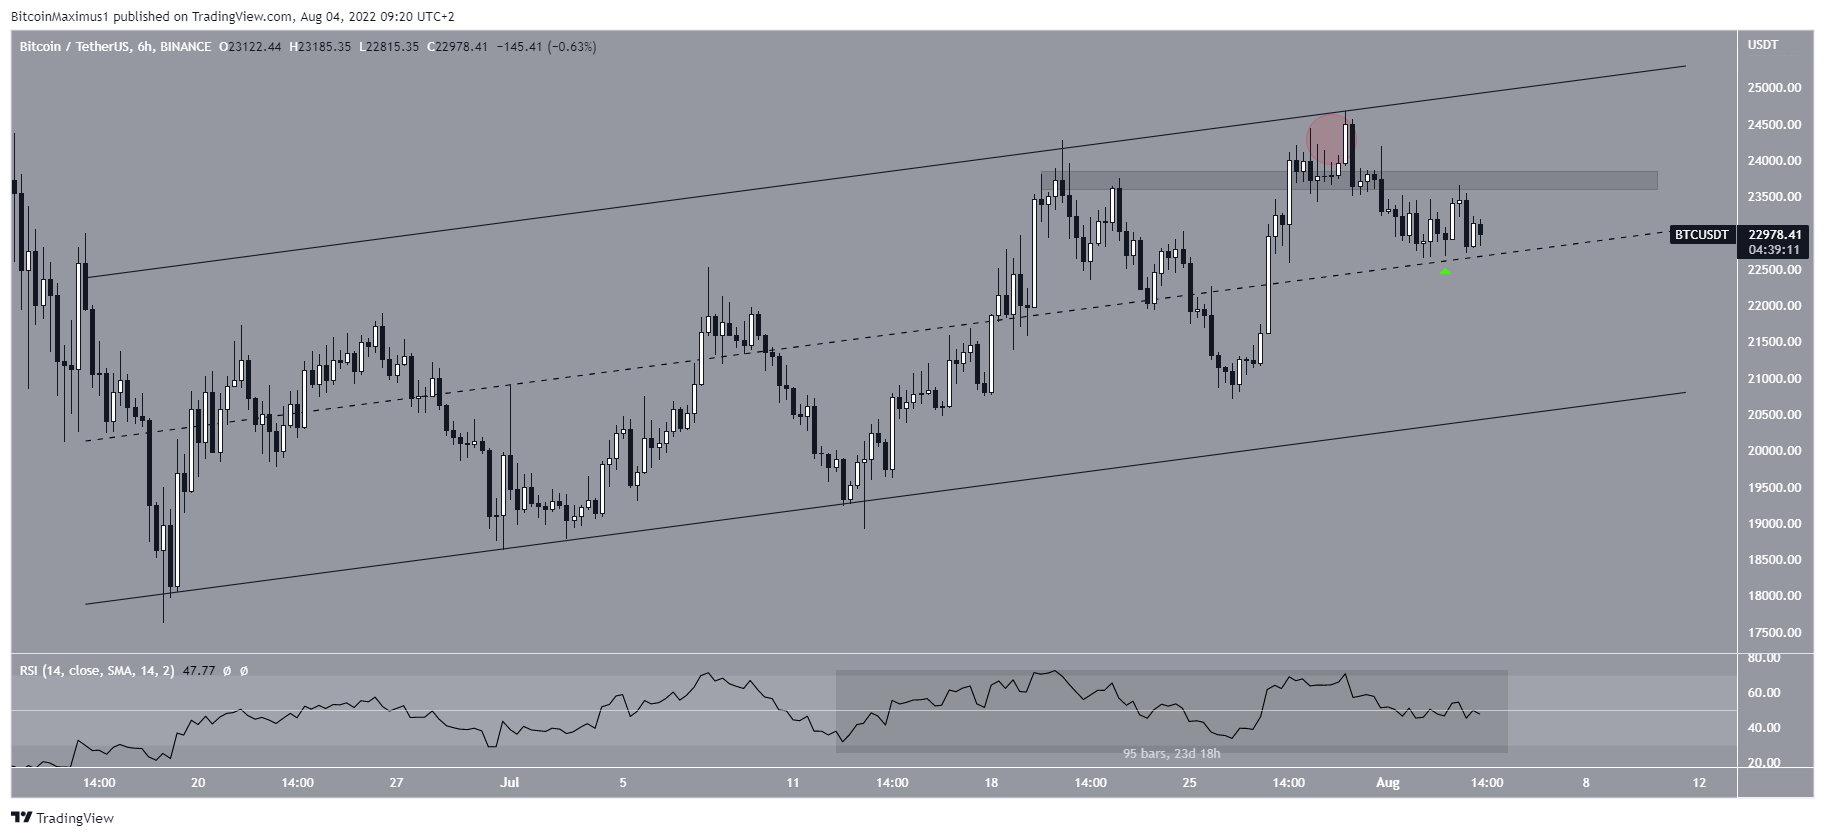
The 6-hour chart does not give any clear signals about the further direction of the trend.
First, bitcoin may be trading inside an ascending parallel channel. This pattern is considered bearish. Accordingly, the most likely scenario is a bearish breakout from this pattern. This scenario is also supported by the price deviation (red circle) followed by a fall below the $23,750 horizontal area.
However, BTC is trading above the channel’s midline and appears to have turned it into support. If the price stays above this mark, there is still a chance of a bullish breakout.
And finally, the RSI is fluctuating on both sides of the 50 mark, which is considered a sign of a neutral trend.
Thus, the 6-hour timeframe is neutral and does not provide any clues as to what the next movement of the coin will be.
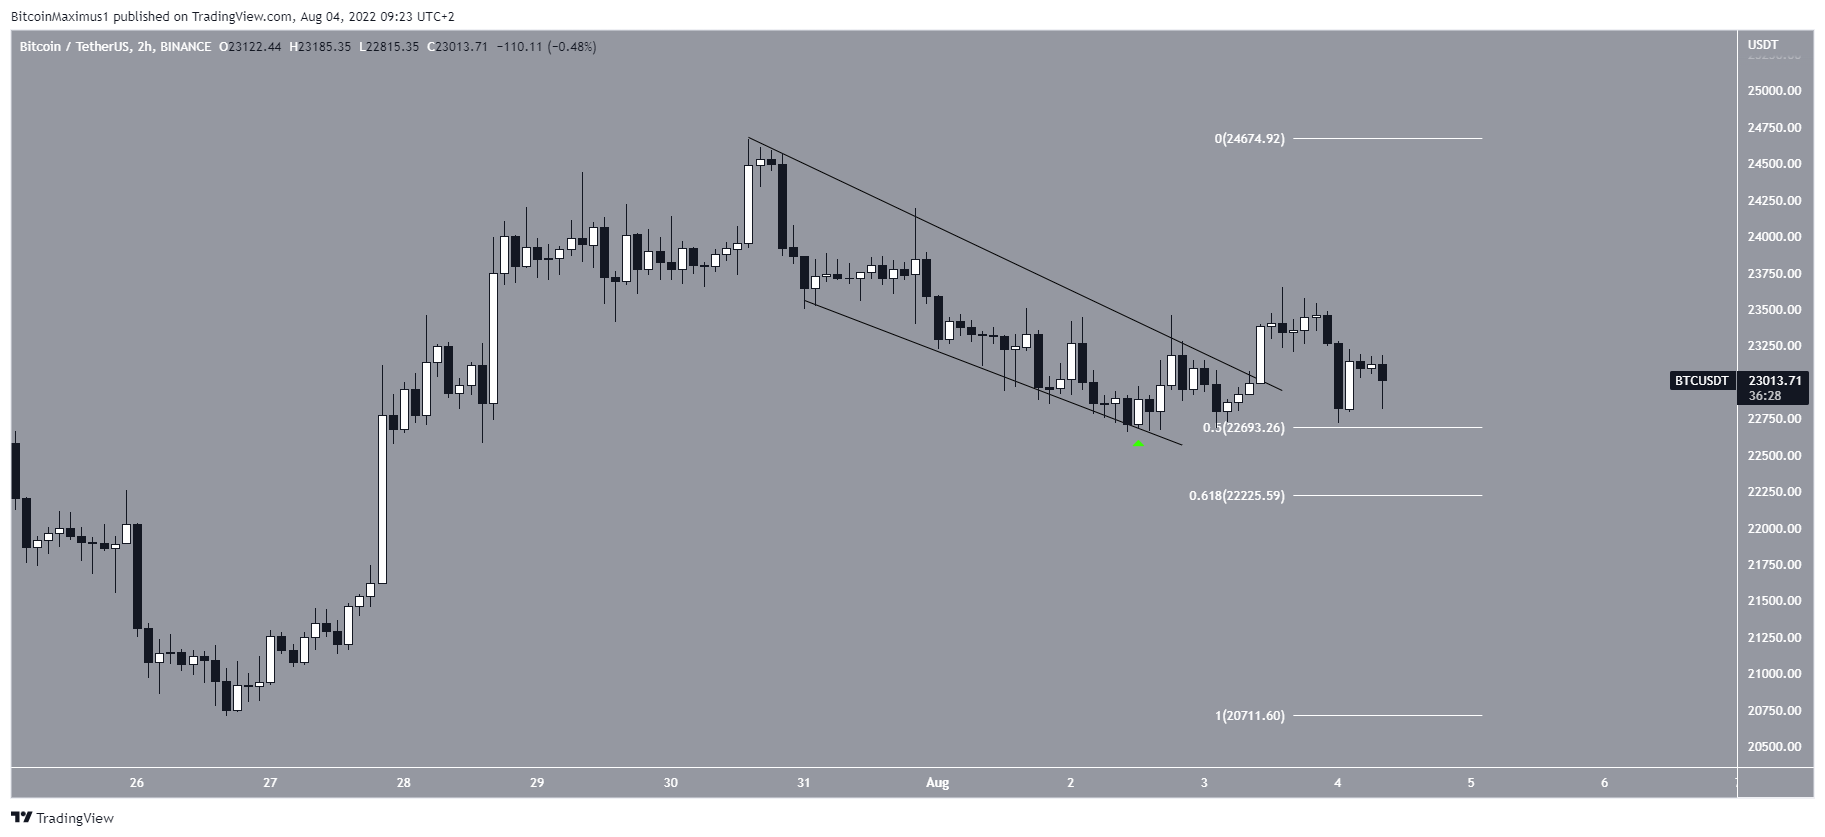
Short-term bullish breakout of BTC
On the 2-hour chart, Bitcoin made a bullish breakout from a short-term descending wedge. This happened on August 3, after the price rebounded from the support formed by the Fibo level of 0.5 corrections.
However, BTC was unable to develop a confident upward trend. Instead, the price returned to the Fibo 0.5 level and is trading near it. This is a significant milestone since the next horizontal support will appear only in the area of $20,700 below on the chart. However, the path to it is blocked by the Fibo level 0.618 of a correction at $22,225, which may cause a price rebound.


Leave a Reply