Glassnode Analysts Point To Signs Of A Bottom Formation In Bitcoin Quotes
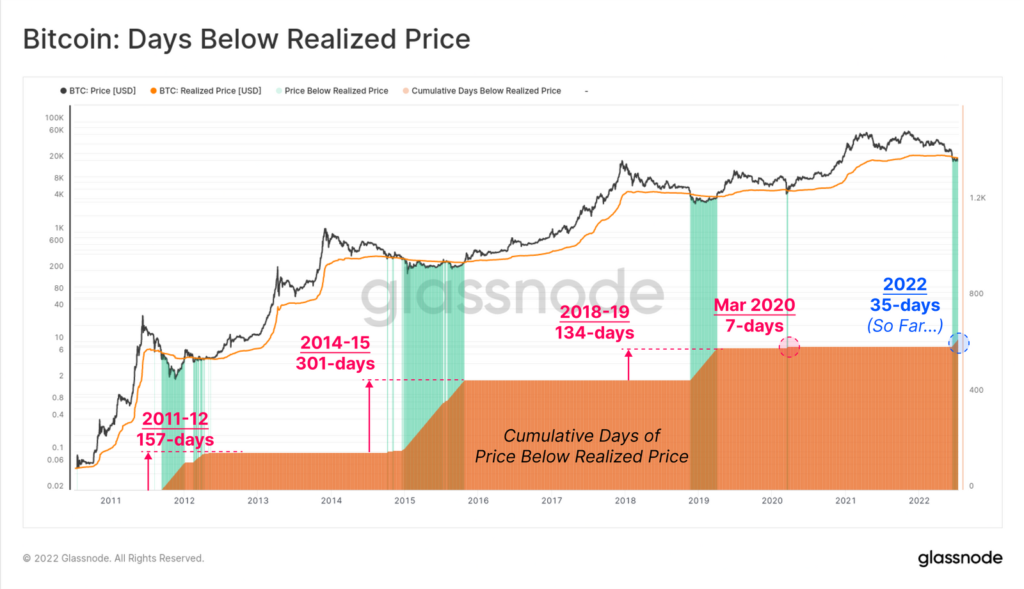
After waves of capitulations in May-June 2022, bitcoin quotes have been below the realized price for a month now. Other bottom formation signals have emerged, Glassnode analysts write.
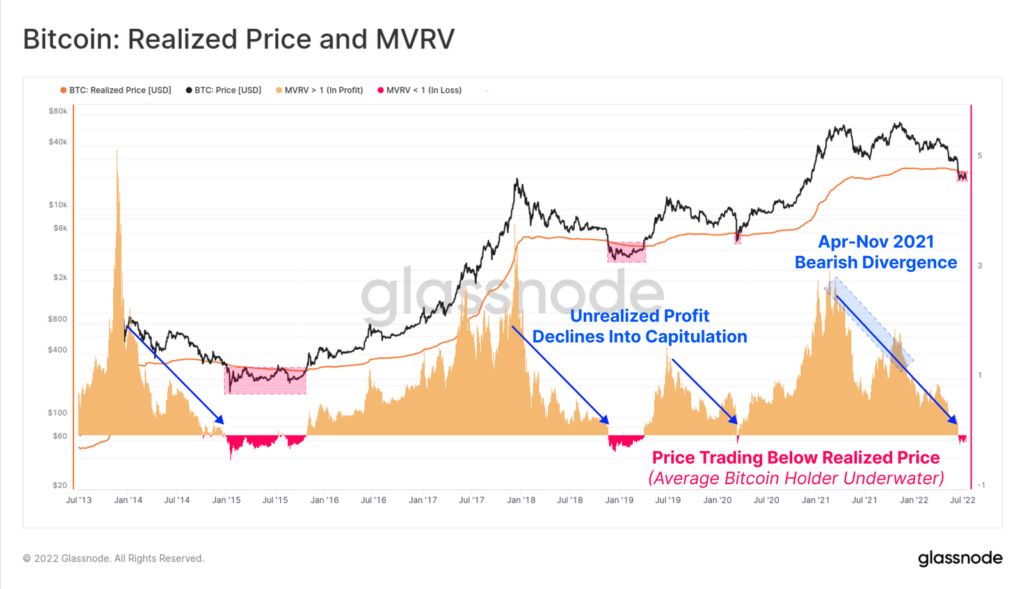
At the time of reporting, the realized price was $22,092, and the market price was $21,069. In other words, the average unrealized loss was 4.67%.
Historically, this divergence has indicated a bottom in a bearish phase. This period ranged from seven days (2020) to 301 days (2015). If we exclude the first episode, which arose as a result of a shock, and not fundamental prerequisites, the average period of the relevance of the signal is 197 days against the accumulated 35 days.
The MVRV indicator has not yet fallen to previous bear phases of 0.953 vs 0.85 (unrealized loss 4.67% vs 15%), leaving room for further price declines and/or time for consolidation before final bottoming experts warned. They added that such a situation could also mean more significant support for investors in the current cycle.
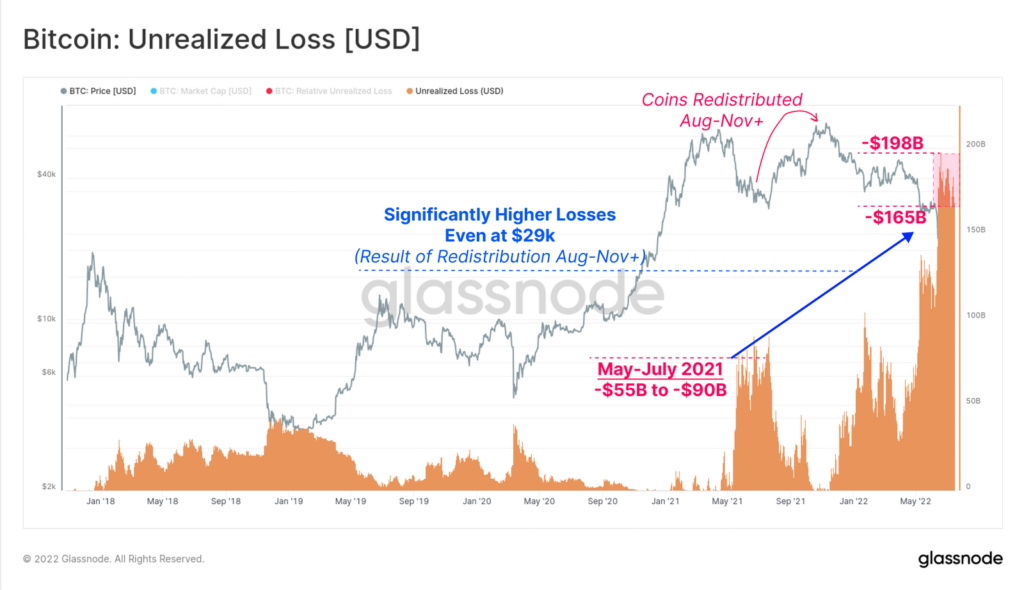
Analysts have highlighted the coins whose holders are experiencing an unrealized loss (those who bought between 2021 and 2022). It ranges from $165 billion to $198 billion, based on a market price range of $17,600–$21,800. This is the equivalent of ~55% of the market capitalization of bitcoin. The figure is higher than in March 2020 and comparable to the 2018 bear market.
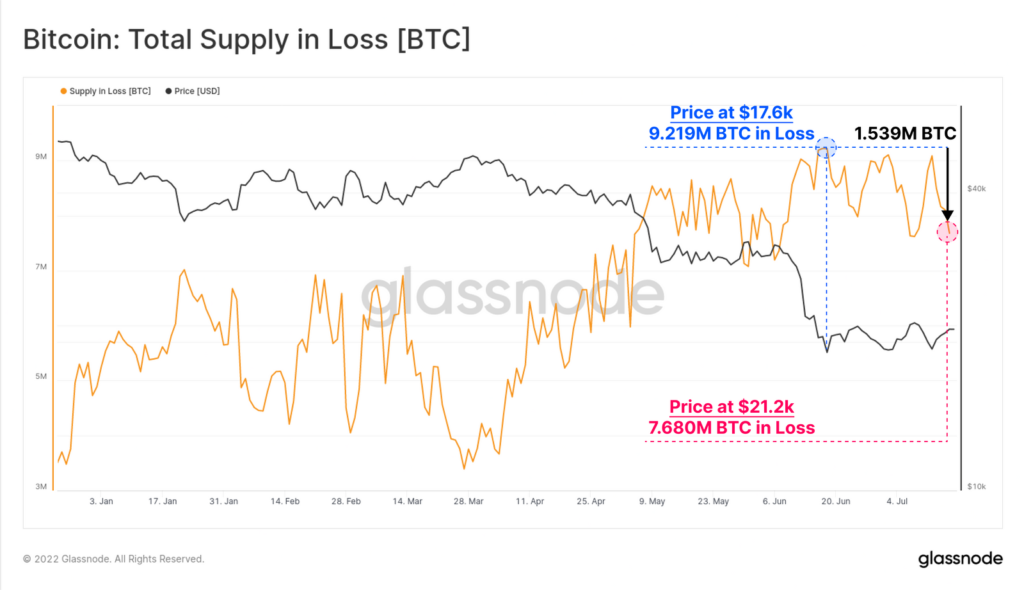
A gradual decrease in the indicator means an improvement in the profitability of holders. This is achieved during the period of capitulations when unrealized losses become realized – coins receive a new lower value with a new owner. As prices rise, these newly acquired bitcoins switch from holding unrealized losses to unrealized gains, usually starting a bull cycle again.
The above hypothesis can be confirmed by data on the number of coins held at a loss. After the capitulation on June 18 (the price dropped to $17,600), this figure was 9.216 million BTC, but a month later, with the price rising to $21,200, the metric dropped to 7.68 million BTC. In other words, ~8% of the available supply has changed in this price range.
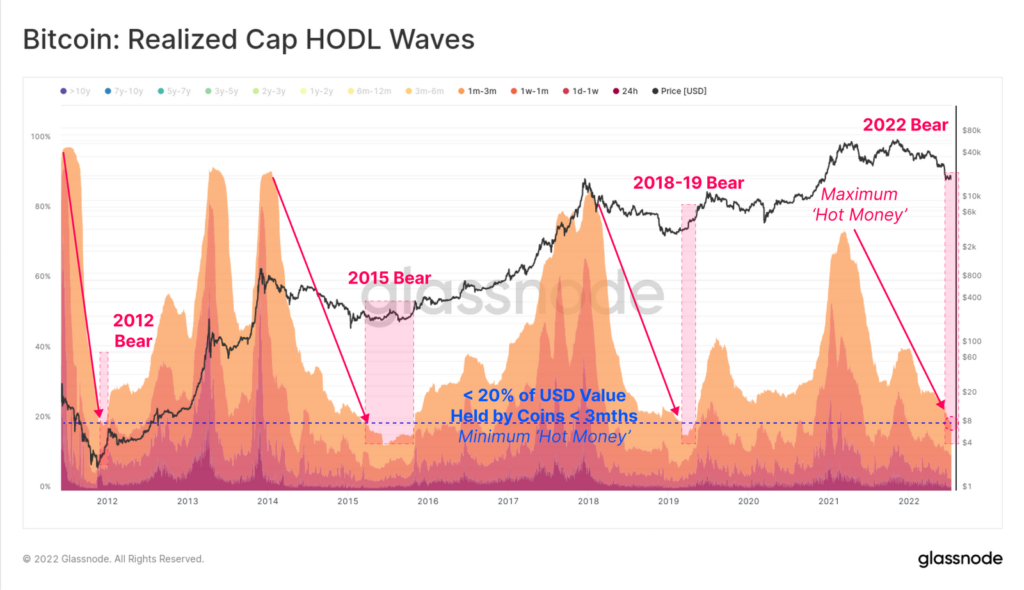
Analysts took advantage of the HODL-waves indicator, distributing the coins held into two categories – up to three months (“hot money”) and more than this period (“holder money”).
They found that the first wave is in a downtrend and has fallen below 20%. From this, experts concluded that holders who do not want to get rid of coins are highly convinced and/or long-term investors strive to accumulate bitcoins by withdrawing them to cold wallets.
In the structure of “Hodlers’ money”, the share of coins “age” older than three months (acquired before the collapse of Terra ) is growing. This can be seen from the increase in the proportion of bitcoins added to wallets from 6 months to two years ago. Previously, participants in this category played a vital role in the surrender, analysts stressed.
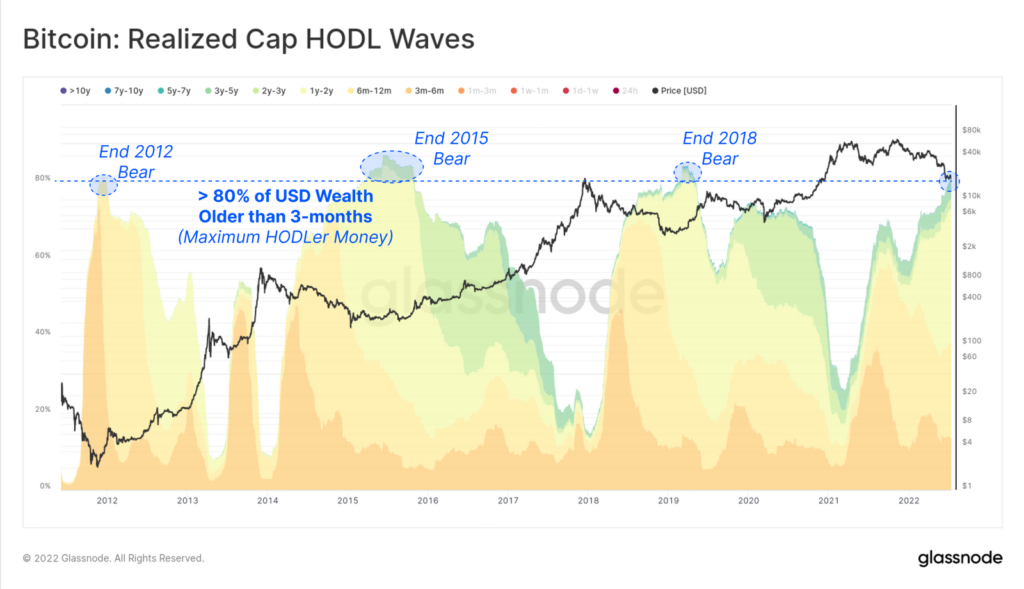
“This is another sign that the market is approaching the point of exhaustion of sellers,” the specialists concluded.
Recall that Grayscale analysts allowed the completion of the crypto winter by the end of March 2023.
In July, Bloomberg strategist Mike McGlone predicted a rise in bitcoin over the next six months.
Earlier, the head of the management company Rockefeller International, Ruchir Sharma, noted that the first cryptocurrency needs to eliminate excess leverage to become sustainable again.


Leave a Reply