Bitcoin (BTC) Recovered Above $23,000 After Brief Hesitation
Bitcoin ( BTC ) has recovered from the minor horizontal support at $22,700 and may now attempt a bullish breakout from a longer-term pattern again soon.
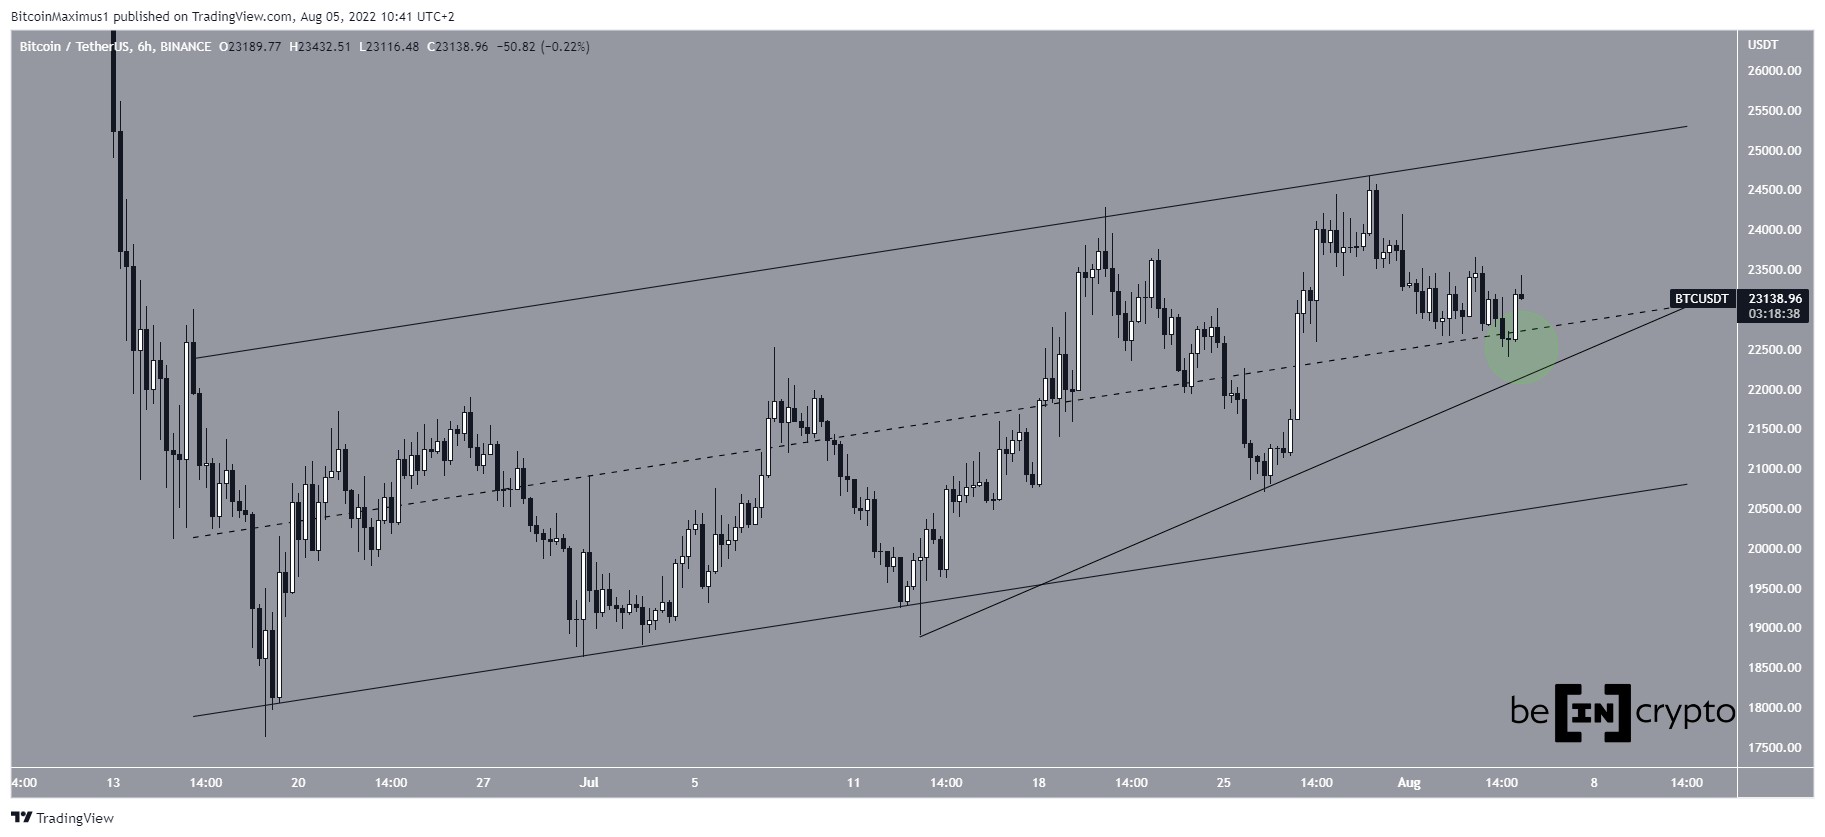
BTC has been trading inside an ascending parallel channel since June 19. Recently, on July 30, bitcoin reached the resistance line of this channel but bounced back and then lost ground.
Now the price is above the $23,000 support convergence area (the median line of the aforementioned channel and a potential ascending support line that has been present on the chart since July 13).
BTC needs to stay above this area for a bullish breakout to continue.

Short-term dynamics
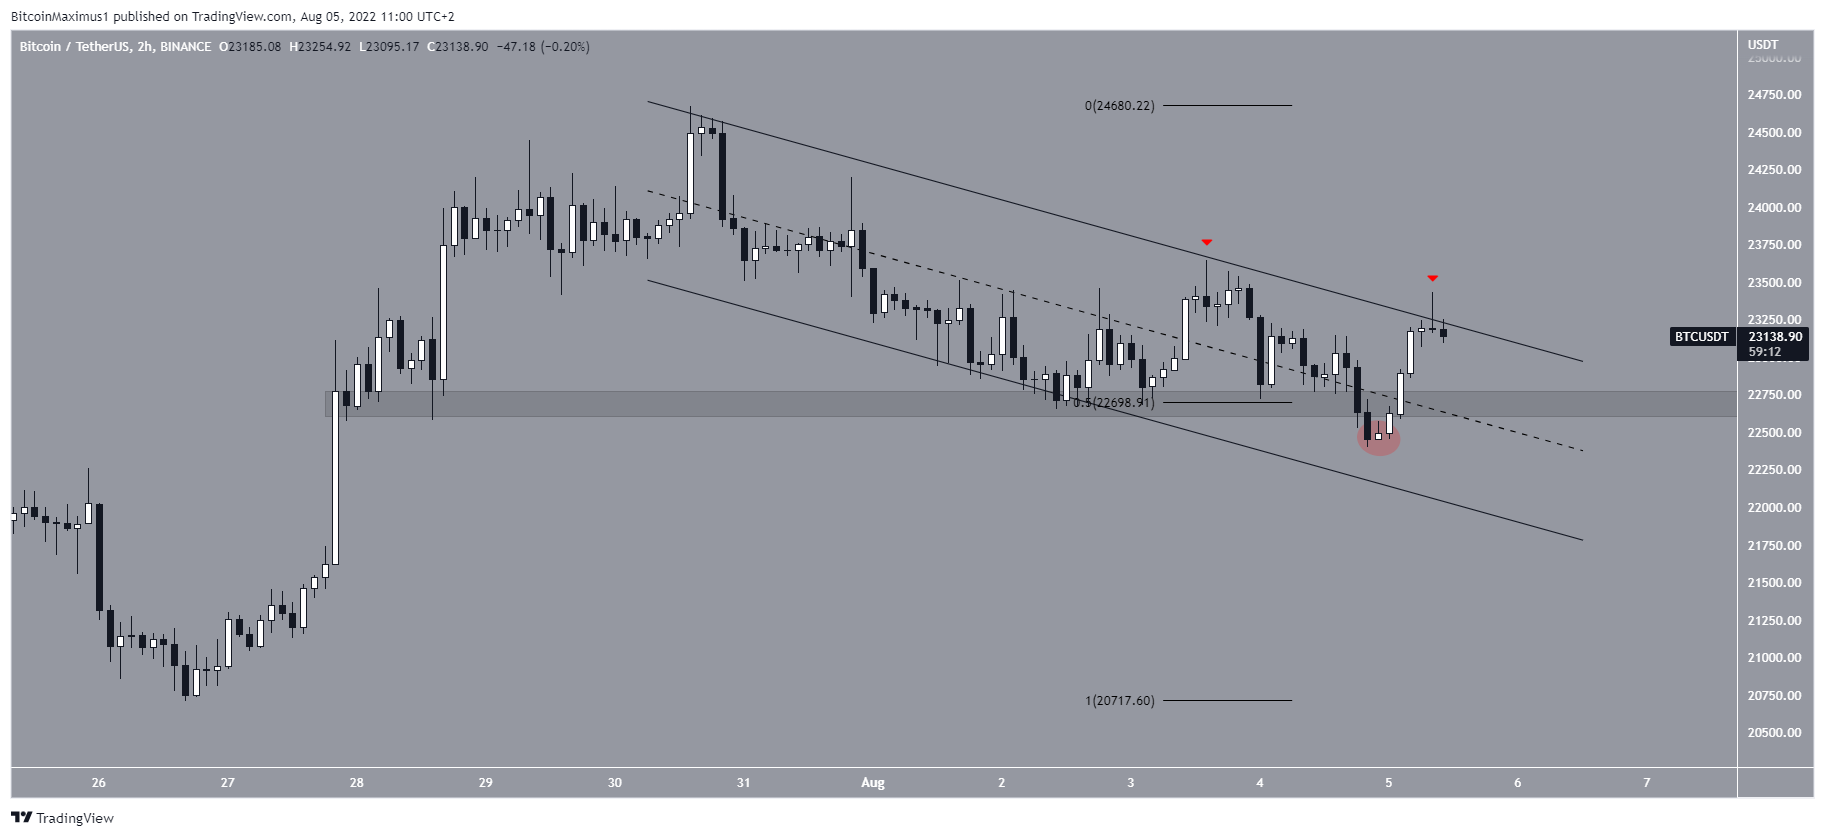
On the 2-hour chart, you can see two arguments in favor of a likely bullish breakout. First, Bitcoin has already made two attempts to break out of the descending parallel channel (red icons). This suggests that now this resistance has become weakened.
Secondly, the price recovered above the $22,700 horizontal support area after a short drawdown below this mark. Now this zone should again play the role of support.
If BTC breaks out of this short-term channel bullishly, the market could head for the long-term channel resistance line.

Wave analysis of BTC
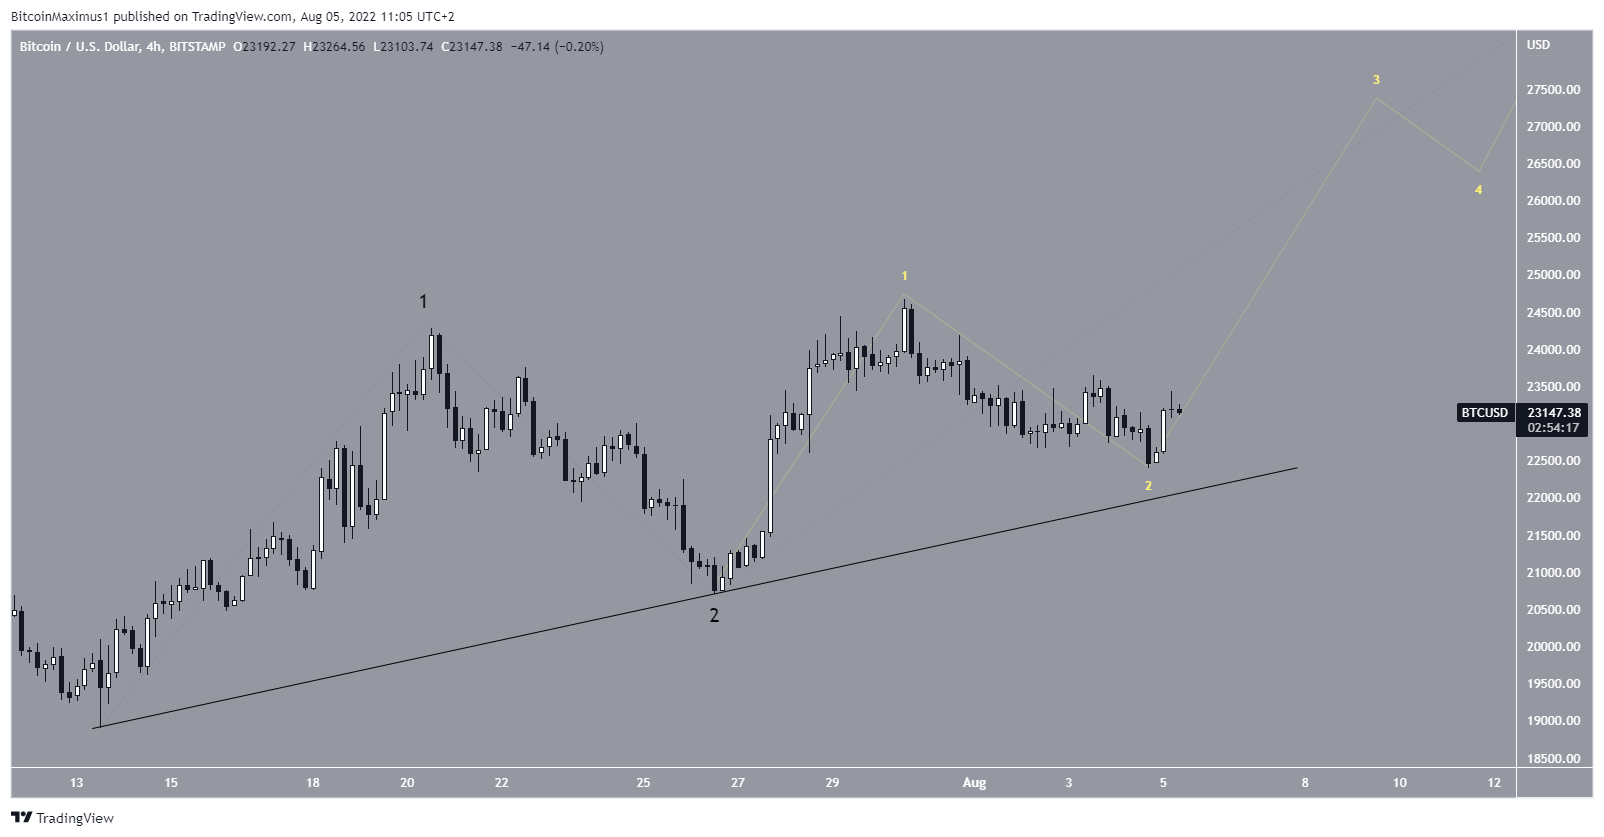
Meanwhile, the most likely short-term wave analysis scenario suggests that Bitcoin is in wave 3 of a five-wave bullish structure (in black).
Subwave analysis is shown in yellow on the chart. It assumes that the price has begun to form sub-wave 3.
As a result, as we can see, this wave structure looks like a 1-2/1-2 formation. This promises the price a significant acceleration in growth rates in the short term.
BTC must remain above the slope of the original 1-2 waves (black) for this scenario to remain viable.
Longer-term wave analysis also supports this prediction.


Leave a Reply